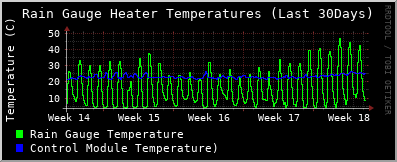
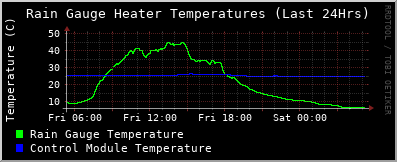
The top two graphs show the temperatures of the rain gauge heater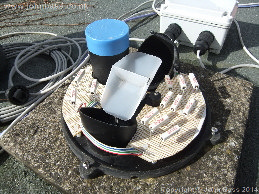 and the control module
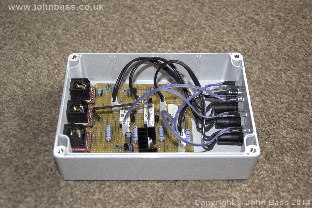
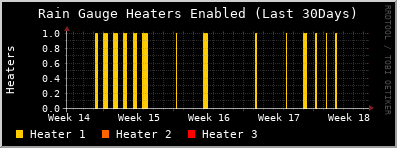
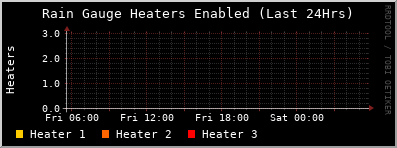
The lower two graphs show the heater status of the rain gauge. There are three independent heater circuits, which are turned on sequentially depending on temperature of the rain gauge.
The graphs are aligned with respect to time, so it can be seen when the heaters come on with respect to temperature.
 |
 |
 |
 |


